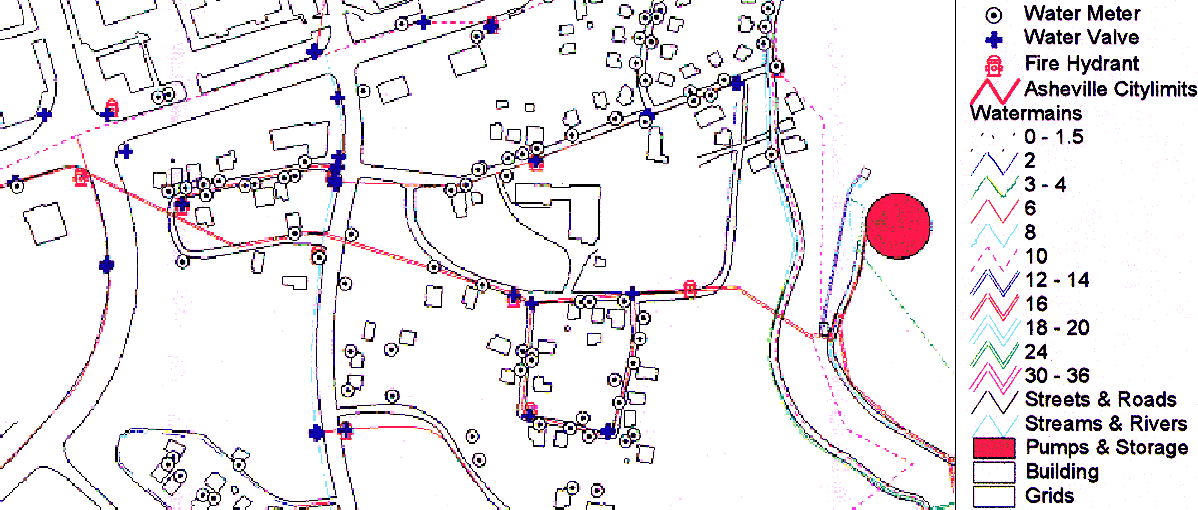
next, Table of Contents

The City of Asheville

Spatial Data and GIS in Western North Carolina

Background

The City of Asheville is located in the Blue Ridge Mountains of Western North Carolina. The City has a population of 67,848 and serves as the economic and service center for a 22 county region. The City's 900-person workforce provides basic City services including fire and police protection, planning and economic development, public works (streets, traffic, solid waste and stormwater services), parks and recreation, and water.

Mission Statement

The City of Asheville will enhance the quality of life for its customers (citizens, employees and visitors) by providing professional and efficient services. The City of Asheville will respond to customer needs, provide for employee development, serve as a partner in the community, and be a leader in Western North Carolina.

What City services benefit from Spatial Data and GIS?

Many services provided by the City of Asheville to the public have improved through the use of spatial data and GIS. We have listed below examples of those services provided by the Water Resources, Public Works, Police, Planning and Development departments. Requests for information can be directed to the GIS representative of these departments, or to the Information Services Division at 259-5510; e-mail to gis@mail.ci.asheville.nc.us. Please reference the City's web site at www.ci.asheville.nc.us for more information about the City and its services.

Water Resources

Community Contact
David Keyes
259-5983
The department uses GIS to better serve its customers and manage its water system. In the early 1990's the need was seen for mapping the entire water system in a form that would allow the manipulation of data in a variety of contents and formats. By the mid 90's field gathering of information was under way with the surveying of system features (hydrants, valves, and meters) occurring.

The department provides information to the City field crews that do maintenance on the water system and to engineering staff for expansion and improvements to the system. We also provide information to other utility workers, fire sprinkler system designers, insurance companies, realtors, and private individuals with questions about area water systems.

The department through GIS can display and relate a great deal of information on a single map. These may include elevations of system hydrants, meters and valves as well as topographical lines in an area enabling water pressure gains and losses to be calculated. Water lines can be shown with relative proximity to where they may actually lay. Within the city limits, lot lines and building outlines can be placed in an area to show water service availability to a given structure, parcel or area. Lot lines are currently not available for county areas.
Click on image for larger picture

Map of Water Lines

As with all databases constant refining and updates are needed. The water system is constantly being improved and expanded to better serve the area. In a typical year some 500 new meter services will be added to the more than 40,000 already existing in the database along with many new valves and hydrants and miles of watermains. Displayed data needs to be field verified to be sure of accuracy.

Request for information can be made to the department by phone (828) 259-5983, or fax (828) 259-5978. Information can be faxed out or picked up at our location at 174 South Charlotte Street in Asheville. Internet access to information may be available in the future. The department expresses its willingness to serve all the concerns of the water customer through its commitment of providing services that meet these needs and GIS does that.

Public Works

Community Contact
Linda Foster
259-5938

Since GIS was introduced to Public Works in 1996 it has become a vital part of our department. Almost every day we learn something new about GIS and discover an application that can improve our operations, program efficiencies, or methods of communicating with customers. The visual presentation capabilities of our GIS software is changing the way we do business and deliver our services to the public!

Our department is using GIS to redistrict truck routes (sanitation, snow removal, street cleaning); develop pedestrian plans; plan and prepare traffic detour maps; inventory items such as sidewalks, tree grates, utility pole locations, the Urban Trail, and many, many other items.
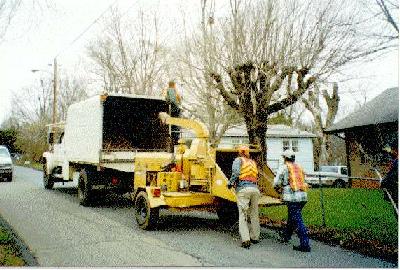
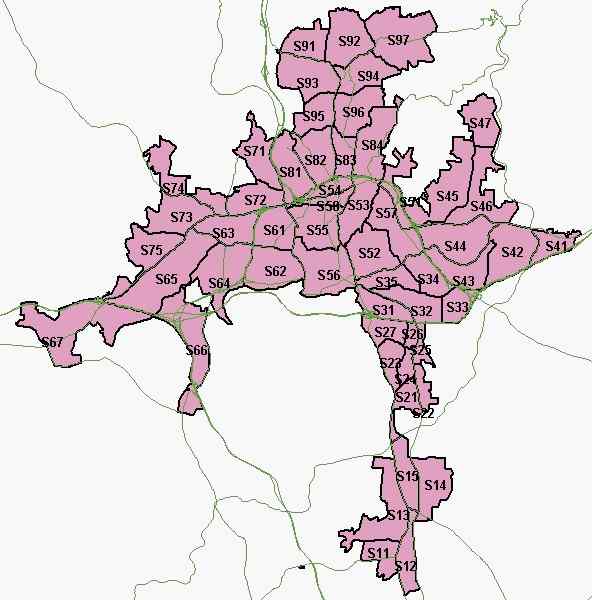
Sanitation re-routing has been the largest project we have accomplished using GIS. We used polygons to create new districts or work areas. All truck drivers had to learn new routes and approximately 18,000 households had a change in their trash collection day. The truck drivers received new route maps with collection points plotted on them and larger color district maps were placed in the local newspaper, all these were produced using GIS. The City's Customer Service staff were provided with a database based upon our work in GIS that allowed easy communication when talking to customers about changes in their collection of recyclables, brush, and trash.
Trash Truck Route (Click to Enlarge)


In day to day use we keep an inventory of almost everything that Public Works is responsible for maintaining. At a click of a button we can pull up a map that shows the location of all existing sidewalks, tree grates, bollards, utility poles, banner locations, and downtown street cans; including the location of all markers and artwork associated with a self-guided walking tour of historic downtown, Asheville's Urban Trail. Each item or theme has a table associated with it and in the table we record specific data for each item (i.e., sidewalk length, date of installation, hardware available, etc.).

GIS will continue to be an important tool for the proper management of our facilities and resources.

Police

You can click the image for a larger version

Community Contact
Debbie Yanik
259-5883

The Asheville Police Department began developing GIS applications in 1996 to use in support of our Community Policing philosophy. A data entry clerk enters the crime report data, from which information is drawn on a regular basis to create reports, charts and maps of community problems.

A key element to the usefulness of the database was the ability to integrate the data into mapping software in order to display and print maps overlaid with crime incident data. The quick analysis of crime and community issues calls is combined with a policy of prioritizing non-emergency calls, thus enabling the officer to plan time for true preventive activity and Community Policing. The GIS helps the officer know where to focus attention if there is a problem area in his district.
The GIS was able to help visually identify the areas where the community's quality of life issues, such as localized criminal activity, nuisance calls and neighborhood health in general were clustered. Then to determine true causes, and inform patrol administration in order to effect appropriate countermeasures. An officer can see a picture of an area that he patrols and what issues face him when he begins his shift.

With the GIS the Police Department has undertaken a project of redrawing the district boundaries and distributing the work allocation to better serve the needs of each individual community. The GIS enables the Police Department to be more efficient in working with the community.

Planning and Development

Community Contact
Paul Benson
259-5843
During 1996 the Planning Department began using GIS to map City zoning. This has opened many new possibilities for analysis. For example, in 1997 the City adopted a completely new zoning map. GIS was used to analyze the relationship of the existing and proposed zoning with actual land use. For example, the new zoning map proposed to significantly reduce the amount of land zoned for multi-family residential use (apartments and condominiums) while creating a corresponding increase in single family residential zoning. This caused affordable housing concerns due to the apparent reduction in potential for multi-family housing. However, by comparing the spatial relationship of zoning and actual land use, and by quantifying this comparison by using GIS, the staff was able to demonstrate to the City Council that the proposed zoning pattern would have little impact on affordable housing as much of the reduction in multi-family zoning was occurring on property already developed with single family housing.
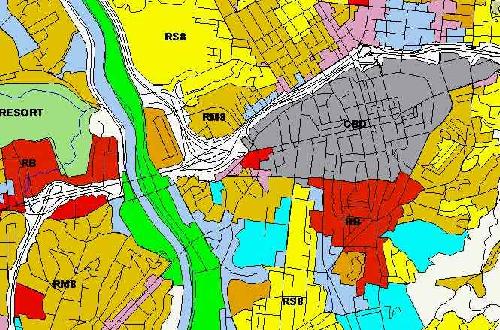
The department is using GIS for urban planning applications including zoning, flood plain protection, annexation planning, public notification of planning and development activities, planning report mapping, and information and map production for a wide variety of special purpose projects in support of other City departments, City boards and commissions and the City Council.

GIS has enabled the staff to produce accurate zoning maps, keep these maps updated and to print the maps at any scale.
Click the image for a larger picture

next, Table of Contents